Telecom Data Visualization


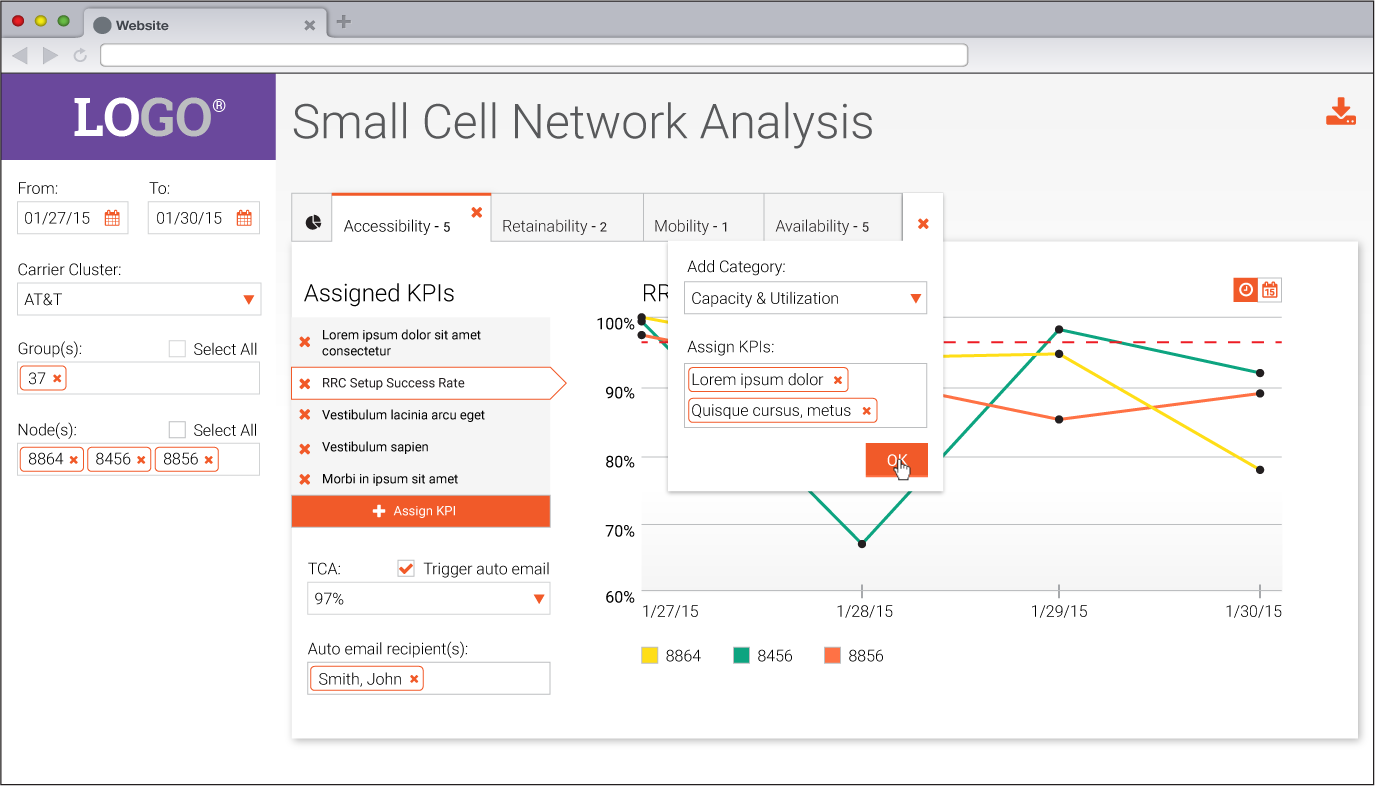
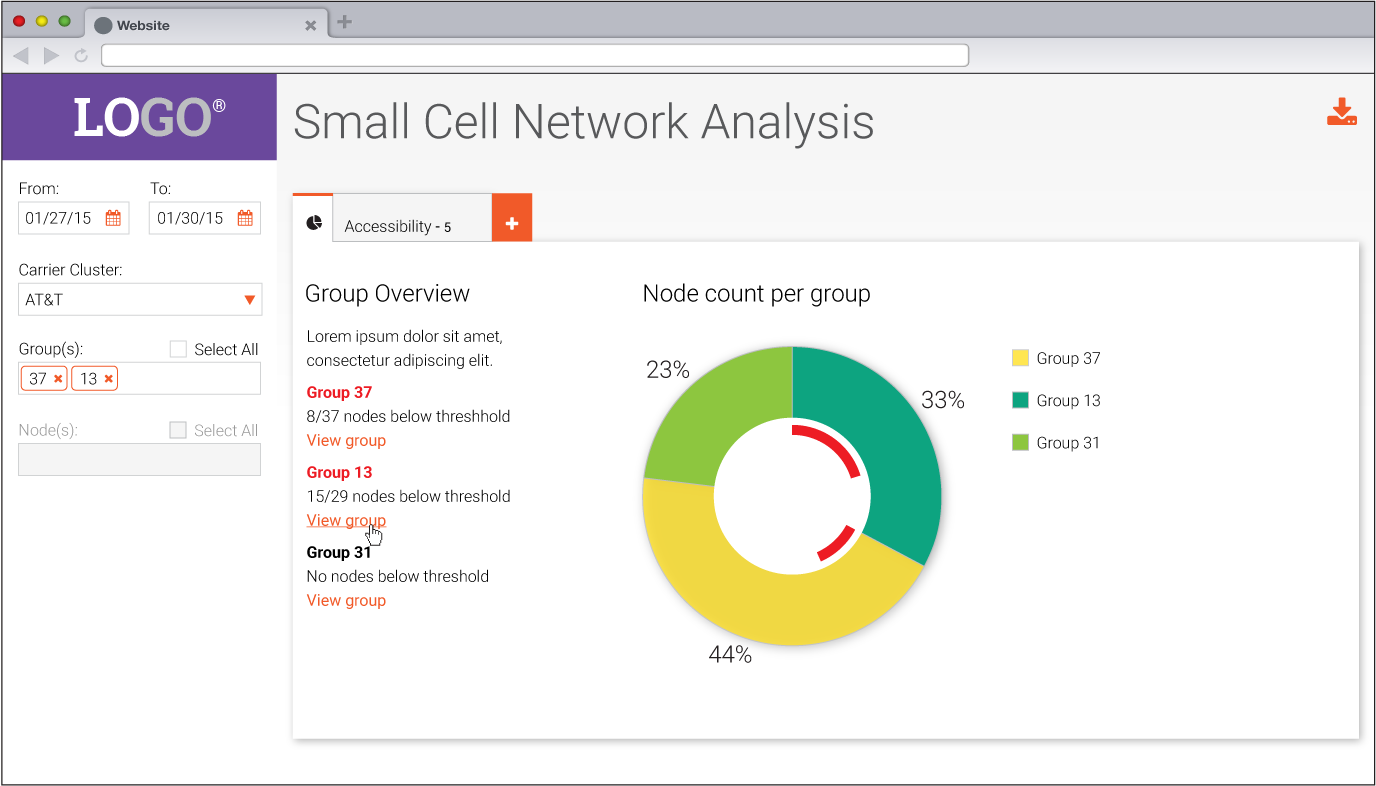
The client had a need to monitor performance across small cell networks in an effort to improve reliability in problematic areas and situations.
The tool was designed to be extremely customizable, allowing multiple data inputs to map across several nodes. The data would then be viewable across different days and locations. Additional features include abilities to set tolerance level parameters and reporting based on any nodes falling within the set parameter. Field technicians would be able to use this data to map out areas of focus on network improvement.